How to Read the Forex Economic Calendar Like a Pro
Stop gambling on the news. Learn how institutional traders use the economic calendar to anticipate volatility, manage risk, and trade the deviation.
Quick Answer
The Anatomy of an Economic Event
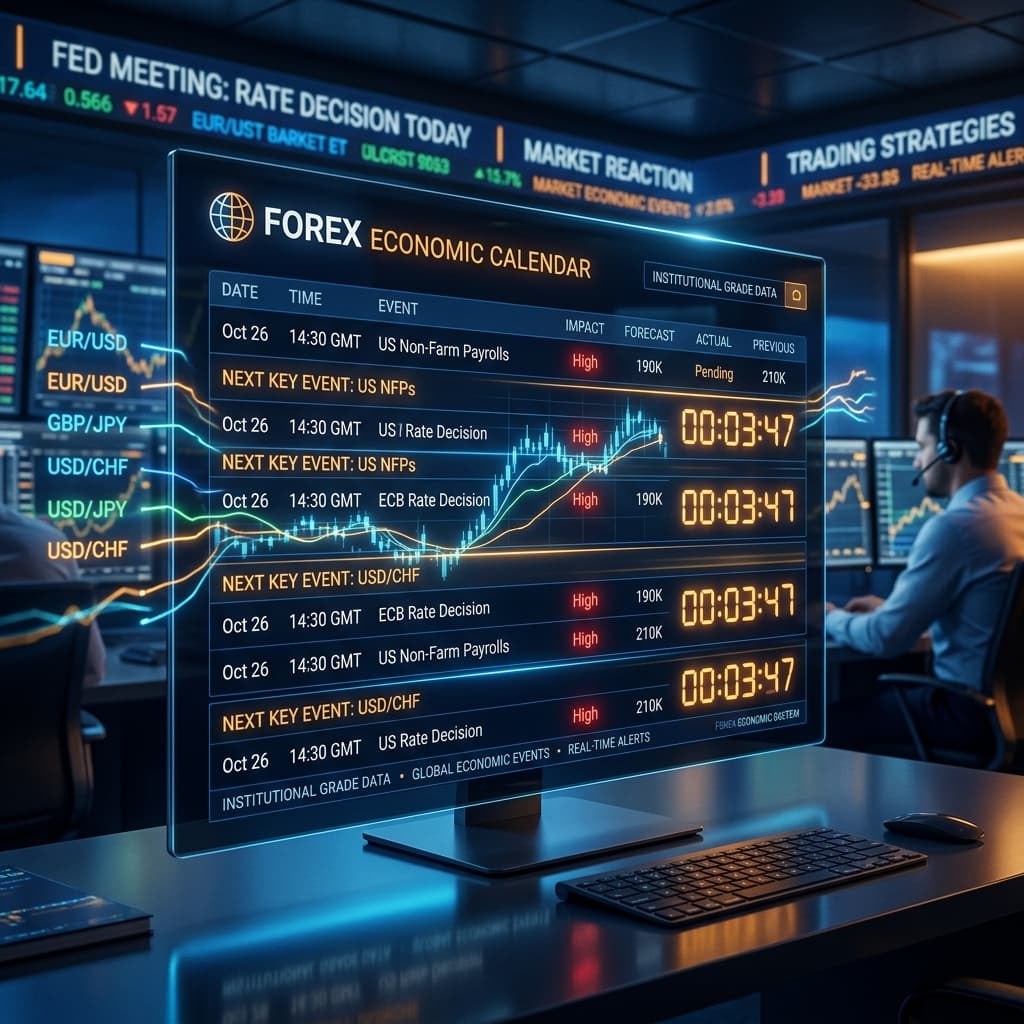
Every event listed on a standard forex calendar (like CPI, NFP, or Central Bank Rate Decisions) contains three crucial data points. Understanding how these three numbers interact is the secret to predicting price action. This is the data point from the last reporting period (e.g., last month's inflation rate). This number provides the baseline trend. Is inflation currently rising or falling? This
An economic calendar is the most critical tool in a fundamental trader’s arsenal. While technical traders stare blindly at charts waiting for a pattern to emerge, macro traders look at the economic calendar to know exactly when the massive surges in institutional volume will occur.
If you don't know how to properly read an economic calendar, you aren't trading—you're gambling.
The Anatomy of an Economic Event
Every event listed on a standard forex calendar (like CPI, NFP, or Central Bank Rate Decisions) contains three crucial data points. Understanding how these three numbers interact is the secret to predicting price action.
1. The Previous Number
This is the data point from the last reporting period (e.g., last month's inflation rate). This number provides the baseline trend. Is inflation currently rising or falling?
2. The Forecast (Consensus)
This is the most important number on the board. The Forecast is the average expectation of top economists and institutional analysts. The market has already "priced in" this number. If the actual data released exactly matches the forecast, the market will usually not move, even if the number itself seems extreme.
3. The Actual Number
This is the real data released at the exact moment of the event. The difference between the "Actual" and the "Forecast" is what creates massive market volatility. This difference is known as the Deviation.
Trading the Deviation
The golden rule of news trading is that you do not trade the absolute number; you trade the deviation from consensus.
Let's use US CPI (Inflation) as an example. The US Dollar is currently strong because the Federal Reserve is keeping interest rates high to fight inflation.
- Previous: 3.4%
- Forecast: 3.1%
Scenario A (The Hawkish Surprise): The Actual number comes in at 3.5%. This is a massive deviation above the forecast. The market realizes inflation is not cooling as expected, meaning the Fed will have to keep interest rates high. The result? The US Dollar skyrockets instantly.
Scenario B (The Dovish Surprise): The Actual number comes in at 2.8%. This is a massive deviation below the forecast. The market realizes inflation is crashing, meaning the Fed can finally cut interest rates. The result? The US Dollar plummets instantly.
The Danger of Revisions
Always pay attention to the tiny text next to the "Previous" number. Governments frequently revise their data from the previous month.
If this month's NFP data comes out exactly at the forecast, but last month's data is quietly revised down by 100,000 jobs, the market will treat the event as a massive miss, and the currency will drop. Retail traders who only look at the headline number will be confused as to why the market is crashing.
How to Protect Your Account
- Avoid the Initial Spread: During High-Impact (Red Tier) news events, brokers massively widen their spreads due to the sudden lack of liquidity. A 1-pip spread can instantly widen to 20 pips, hitting your stop loss before the price even moves.
- Trade the Aftermath: Professional traders let the algorithms fight it out during the first 15 minutes. Once the dust settles and a clear trend emerges based on the data, they enter the market.
- Confirm with the Dashboard: Never guess which way the market is absorbing the news. Wait for the data to drop, and immediately look at our Live Currency Strength Matrix. If the USD instantly hits a score of 85+ across all timeframes, you have mathematical confirmation that institutions are buying the news.
Frequently Asked Questions
What are the most important events on the calendar? Tier 1 events include US Non-Farm Payrolls (NFP), Consumer Price Index (CPI), and Central Bank Rate Decisions (FOMC, ECB, BOE).
Why does the price spike in both directions during news? This is a "liquidity grab." Institutional algorithms will intentionally spike the price down to trigger retail stop-losses (creating liquidity), before aggressively buying and pushing the price in the true fundamental direction.
Can I trade the news on exotic pairs? No. Exotic pairs suffer from extreme liquidity vacuums during news events. You will experience massive slippage. Stick to major pairs like EUR/USD or USD/JPY.
Trade the news intelligently. Confirm the institutional reaction to major economic data instantly using our Live Market Dashboard.
Apply This Knowledge
See It Live on the Currency Strength Meter
Put this analysis into practice. Track real-time momentum across all 8 major currencies — free, no account needed.
Currency Strength Hub Team
CurrencyStrengthHub Editorial & Research Team
The CurrencyStrengthHub Editorial & Research Team comprises seasoned market analysts, quantitative developers, and active traders. We specialize in absolute currency strength models, global macroeconomic analysis, and creating data-driven tools for retail forex traders.